Take a moment, a few seconds, to close your eyes and visualise the Earth as seen from space. You will probably see the seas and oceans, so vast we call Earth the Blue Planet, the continents, with their beautiful shades of ocre and green, enveloped in a blanket of clouds. As a modeller, developing mathematical models of the Earth to produce forecasts of e.g. the weather and river flows, you very often have to break the Earth down into several different components: the atmosphere, the land surface and the ocean. Let’s explore together why!
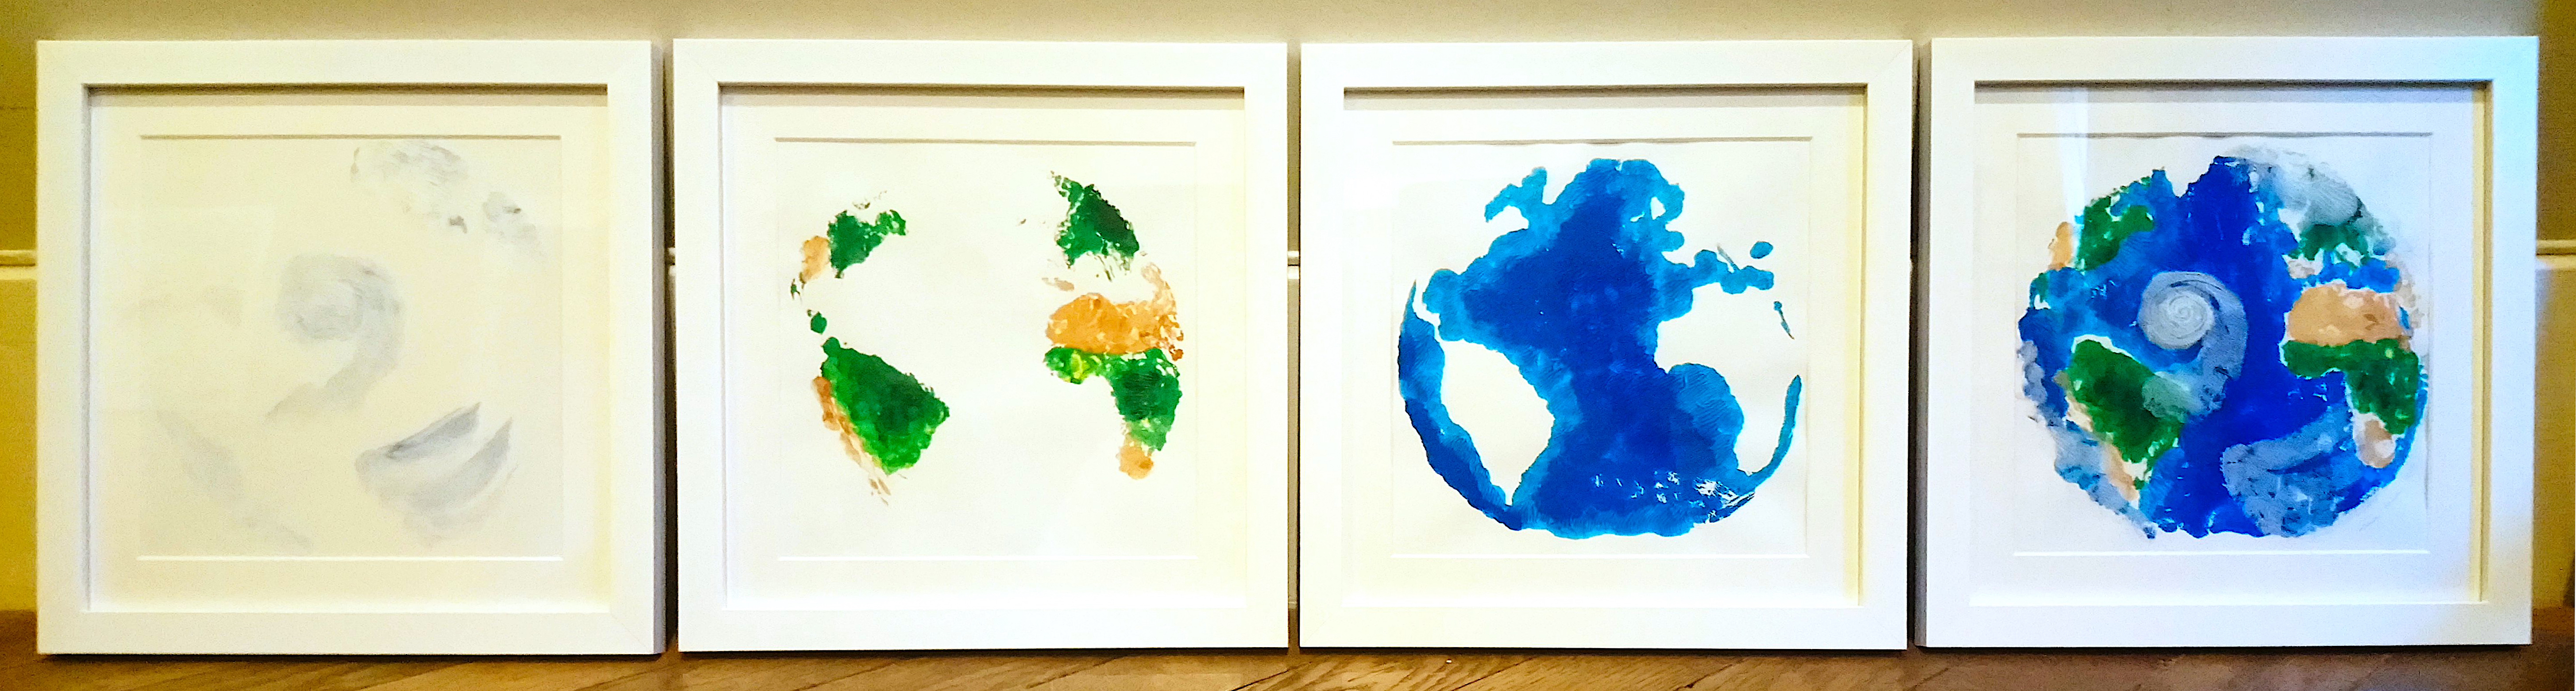
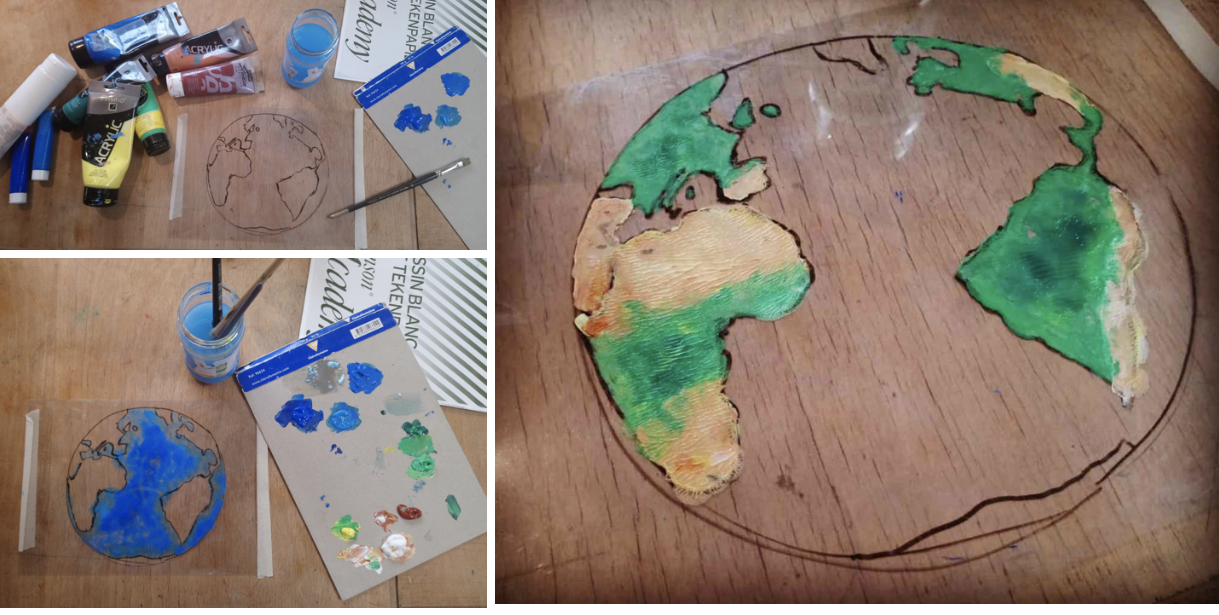
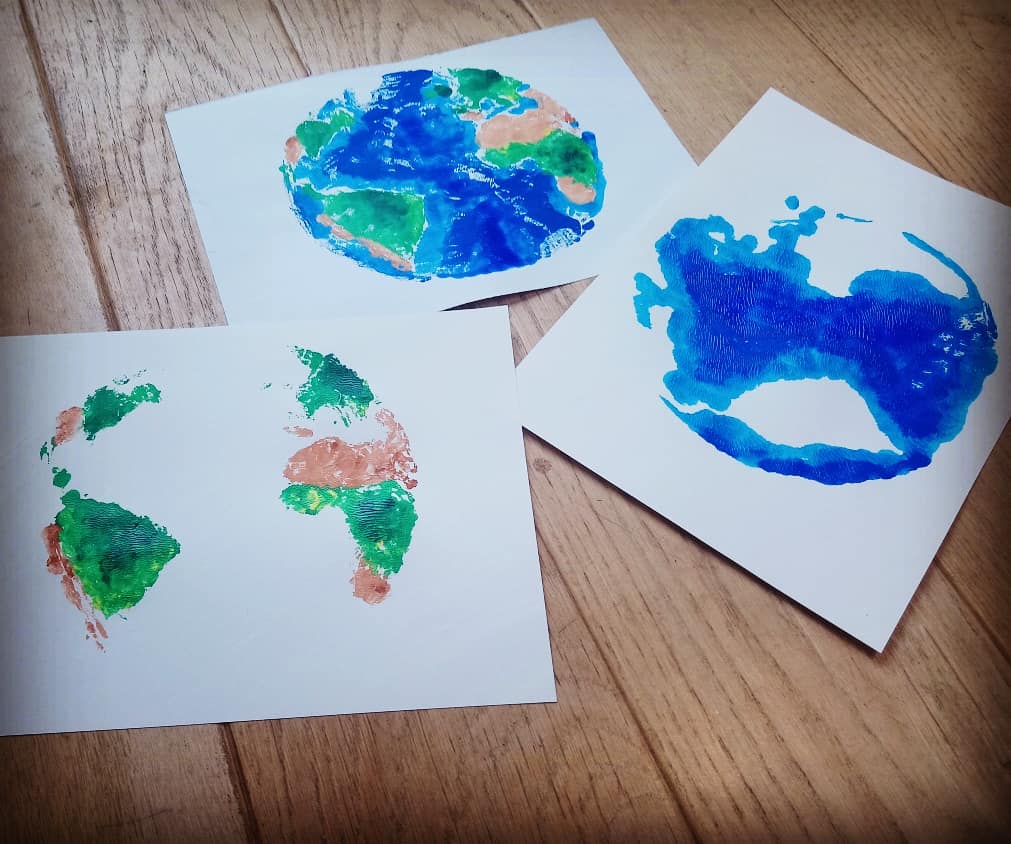
I created this piece with monoprints. I first drew the contours of the Earth on a transparent plastic sheet. I then added layers of paint to this plastic sheet (as shown on the photos of the process below) before pressing a sheet of white paper on top of it to transfer the colours onto the page. After a first failed attempt (I forgot to turn around the plastic sheet before applying the paint and created a flipped version of the Earth) this repetitive process yielded four beautifully unique pieces.
The uniqueness and yet the similarity of every piece is what makes this technique very appealing to me. Even if the starting design is the same, ever so slightly different quantities and shades of the paint applied combine to create uniquely similar outputs. The amount of pressure applied when transferring the paint onto the white page can also give different textures (see for example the wave-like textures on the oceans on the bottom photo, bottom right piece). This uncertain process echoes beautifully with the idea of chaos in forecasting (read one of my previous blog posts, Chaos experiment, to find out more).
The resulting piece, a series of four prints, explores the way in which mathematical models represent the Earth to create weather and river flow forecasts. Models that represent the Earth’s atmosphere, land surface and ocean separately are called uncoupled models. With time, we have gained a better (scientific) understanding of the Earth’s physical processes (e.g. how tropical cyclones form, how the water cycle works, or how the climate is changing). We now know that it is important to combine these different models (of the atmosphere, land surface and ocean) into a single coupled model to better represent the interactions that happen at the boundaries between what we long thought were individual components. In other words, in coupled models, the atmosphere, land surface, and ocean talk to one another. But uncoupled models are not only a relic of a past understanding of our Earth system. We now have better and faster computers that allow us to run these more complex models.
So, more concretely, what are some examples of processes for which the interactions between the atmosphere-land-ocean are important?
Tropical cyclones illustrate this very well. Tropical cyclones get most of their energy from the heat transported from the ocean into the atmosphere. They need ocean temperatures of at least 27°C (compared to a global average of ~16°C) to a depth of ~50m. If the depth of warm water is too shallow, the amount of energy released into the atmosphere may decrease and the tropical cyclone may weaken quite quickly (read Rebecca Emerton’s blog post Natural Hazards: Hurricanes, Typhoons & Cyclones to find out more about tropical cyclones or the ECMWF blog post How to couple the ocean, sea ice and the atmosphere in forecasts by Kristian Mogensen to find out more about coupled forecasting). Artist and philosopher Renate Quehenberger recently collaborated with Kristian Mogensen, myself, and scientists from the the European Commission’s JRC to create the SciArt project GAIA 5.0. Its centrepiece is a 3D virtual reality installation showing the development of 2 tropical cyclones in 2018, based on ECMWF data.
The water cycle is another very good example of these interactive processes. The entire water cycle is based on a series of interactions between the atmosphere-land-ocean. For example, how much water evaporates from the oceans will influence how much rain will fall on the land and how much water will flow through the nearby rivers (too much? too little?). Working with uncoupled models you may lose valuable information about these interactions, which in turn might impact the quality of your weather and river flow forecasts. For my work on forecasting river flow on seasonal timescales (for the next several months), making sure the atmosphere, land surface and ocean “talk to one another” is very important as a lot of the slow influential factors live at the boundaries between these components. A good example of such factors is the El Niño events, a warming of the surface waters in the Pacific Ocean which can cause floods or droughts months after and kms away! (find out more in Rebecca Emerton’s post What is El Niño? (And can it really impact coffee & chocolate prices?) and in this NASA Earth Observatory post). You’re probably asking yourself: what about processes on even longer timescales, like climate change? You’re exactly right!
Climate models describe atmosphere-land-ocean physical processes to help us understand how the climate is changing. But biological and chemical processes also have an impact on the Earth’s climate. For example: plants and industries change levels of CO2 (and other greenhouse gases) in the atmosphere, ocean currents determine the nutrients available to phytoplankton, and temperature and rainfall shape life on land (droughts affect plant cover, which may in turn dampen or exacerbate the drought). Models that represent a broad range of interactions are called Earth system models (ESM; read this Nature Education article to find out more).
Randall et al.’s 2018 article, 100 Years of Earth System Model Development, provides a great overview of the birth and evolution of ESM.

I created this piece for The first ECMWF science and art exhibition, which I co-curated earlier this year. At this exhibition, over 80 artworks from 27 artists and scientists were displayed in the ECMWF Weather Room from 18-21 February 2020. The displayed sculptures, paintings and photography all conveying weather-related topics in their own beautifully unique ways. Have a look at the blog post (link above) to see the exhibition highlight video.
Whilst we have made immense progress in coupled modelling over the last decades, it goes without saying that there are still many scientific and technological challenges to tackle. What will be the future of coupled modelling? Digital twins of the Earth ingesting a vast array of Earth observations? As Randall et al. (2018) state in their article: “A comprehensive ESM can simulate many of the emergent phenomena that we see in nature, but the output of such a simulation is just a pile of numbers; it is not an explanation of the natural world. To claim that we understand […] the real world, we must work to create much simpler models that can […] reproduce the key results of the comprehensive models”.
Ultimately, I believe that the solution to making progress in representing our beautifully interconnected Earth is working with an interconnected and diverse group of (computer) scientists, computer engineers, artists, philosophers, and many more. Fostering dialogues across a wider audience has the power to lead to new out-of-the box ideas to tackle current environmental issues.
This blog post was also published on my SciArt blog.

USask/Canmore Computational Hydrology at CWRA 2022: things not to miss!
Posted on 05 Jun 2022
USask/Canmore Computational Hydrology at EGU 2022: things not to miss!
Posted on 15 May 2022
USask/Canmore Computational Hydrology at AGU 2021: things not to miss!
Posted on 10 Dec 2021 Posted on 01 Oct 2021